In MariaDB 10.2.12, these two don’t yet work together. GTID = Global Transaction ID. In the master-slave asynchronous replication realm, this means that you can reconnect a slave to another server (change its master) and it’ll happily continue replicating from the correct point. No more fussing with filenames and offsets (which of course will both differ on different machines).
So in concept the GTIID is “globally” unique – that means it’s consistent across an entire infra: a binlogged write transaction will have the same GTID no matter on which machine you look at it.
OK: if you are transitioning from async replication to Galera cluster, and have a cluster as slave of the old infra, then GTID will work fine.
PROBLEM: if you want to run an async slave in a Galera cluster, GTID will currently not work. At least not reliably.
The overview issue is MDEV-10715, the specific problem is documented in MDEV-14153 with some comments from me from late last week. MDEV-14153 documents cases where the GTID is not in fact consistent – and the way in which it isn’t is most disturbing.
The issue appears as “drift”. A GTID is made up of R-S-# where R is replication domain (0 unless set by an app), S for server-id where the write was originally done, and # which is just a number. The only required rule for the # is that that each next event has to have a higher number than the previous. In principle there could be #s missing, that’s ok.
In certain scenarios, the # part of the GTID falls behind on the “other nodes” in the Galera cluster. There was the node where the statement was first issued, and then there are the other nodes which pick up the change through the Galera (wsrep) cluster mechanism. Those other nodes. So at that point, different nodes in the cluster have different GTIDs for the same query. Not so great.
To me, this looked like a giant red flag though: if a GTID is assigned on a commit, and then replicated through the cluster as part of that commit, it can’t change. Not drift, or any other change. So the only possible conclusion must be that it is in fact not passed through the cluster, but “reinvented” by a receiving cluster node, which simply assumes that the current event from a particular server-id is previous-event id + 1. That assumption is false, because as I mentioned above it’s ok for gaps to exist. As long as the number keeps going up, it’s fine.
Here is one of the simplest examples of breakage (extract from a binlog, with obfuscated table names):
# at 12533795
#180704 5:00:22 server id 1717 end_log_pos 12533837 CRC32 0x878fe96e GTID 0-1717-1672559880 ddl
/*!100001 SET @@session.gtid_seq_no=1672559880*//*!*/;
# at 12533837
#180704 5:00:22 server id 1717 end_log_pos 12534024 CRC32 0xc6f21314 Query thread_id=4468 exec_time=0 error_code=0
SET TIMESTAMP=1530644422/*!*/;
SET @@session.time_zone='SYSTEM'/*!*/;
DROP TEMPORARY TABLE IF EXISTS `qqq`.`tmp_foobar` /* generated by server */
/*!*/;
Fact: temporary tables are not replicated (imagine restarting a slave, it wouldn’t have whatever temporary tables were supposed to exist). So, while this event is stored in the binary log (which it is to ensure that if you replay the binlog on a machine, it correctly drops the temporary table after creating and using it), it won’t go through a cluster. Remember that Galera cluster is essentially a ROW-based replication scheme; if there are changes in non-temporary tables, of course they get replicated just fine. So if an app creates a temporary table, does some calculations, and then inserts the result of that into a regular table, the data of that last bit will get replicated. As it should. In a nutshell, as far as data consistency goes, we’re all fine.
But the fact that we have an event that doesn’t really get replicated creates the “fun” in the “let’s assume the next event is just the previous + 1” logic. This is where the drift comes in. Sigh.
In any case, this issue needs to be fixed by let’s say “being re-implemented”: the MariaDB GTID needs to be propagated through the Galera cluster, so it’s the same on every server, as it should be. Doing anything else is always going to go wrong somewhere, so trying to catch more cases like the above example is not really the correct way to go.
If you are affected by this or related problems, please do vote on the relevant MDEV issues. That is important! If you need help tracking down problems, feel free to ask. If you have more information on the matter, please comment too! I’m sure this and related bugs will be fixed, there are very capable developers at MariaDB Corp and Codership Oy (the Galera company). But the more information we can provide, the better. It often helps with tracking down problems and creating reproducible test cases.
FastCGI has many advantages, and it’s our preferred interface when it’s available for the required script language (such as PHP). However, we generally see environments where the php-fpm processes (for instance) are run on the same system as the web server, even though that’s not necessary. In FastCGI space, the web server (say nginx) passes a request through a socket or TCP/IP address:port, and the application delivers back an response (web page, web service JSON result, etc). Obviously sockets only work locally, but the port can be on another machine.
So the question is, how do you arrange your virtual server rack? While splitting things out like that tends to add a few ms of latency, the advantages tend to justify this approach:
Not running PHP on your web-server, and only having connectivity web-server -> application, is good for security:
should the web server get compromised, it can still only make application requests, not reconfigure the application server in any way;
should the application get compromised, it will not be able to gain control over the web-server as there is no connectivity path in that direction.
nginx is exceedingly good at “smart proxy”-style tasks, and that’s essentially already what it’s doing with FastCGI anyway;
you could have multiple application servers, rather than just one. Optionally scaled dynamically as traffic needs change;
this effectively turns nginx into a kind of load-balancer for the application server back-ends; the way you specify this is through
a single name that resolves to multiple address which are then used in a round-robin fashion (not necessarily optimal as some requests may take longer than others), or
a server group as provided by the ngx_http_upstream_module module.
nginx can detect when a back-end is unresponsive, and connect to an alternative;
thinking back to the fact that some requests take longer than others, that’s usually URL-specific. That is, it’s relevant for queries in certain areas (such as reporting, or drill-down type searches) of a web interface. Now, you can tell nginx to use a different FastCGI destination for those, and thus separate (insulate, really) the handling of that application traffic from the rest of the application.
This all fits very neatly with containers, should your infrastructure use those or if you’re considering moving towards containers and micro-services.
The possibilities are quite extensive, but naturally the details and available options will depend on your needs and what you already have in place. We regularly help our clients with such questions. Solutions Architecture, both for evolving existing environments as well as for greenfield projects.
I promised to do a pricing post on the Amazon RDS Aurora MySQL pricing, so here we go. All pricing is noted in USD (we’ll explain why)
We compared pricing of equivalent EC2+EBS server instances, and verified our calculation model with Amazon’s own calculator and examples. We use the pricing for Australia (Sydney data centre). Following are the relevant Amazon pricing pages from which we took the pricing numbers, formulae, and calculation examples:
“Volume storage for EBS Provisioned IOPS SSD (io1) volumes is charged by the amount you provision in GB per month until you release the storage. With Provisioned IOPS SSD (io1) volumes, you are also charged by the amount you provision in IOPS (input/output operations per second) per month. Provisioned storage and provisioned IOPS for io1 volumes will be billed in per-second increments, with a 60 second minimum.”
Storage Rate $0.138 /GB/month of provisioned storage “For example, let’s say that you provision a 2000 GB volume for 12 hours (43,200 seconds) in a 30 day month. In a region that charges $0.125 per GB-month, you would be charged $4.167 for the volume ($0.125 per GB-month * 2000 GB * 43,200 seconds / (86,400 seconds/day * 30 day-month)).”
I/O Rate $0.072 /provisioned IOPS-month “Additionally, you provision 1000 IOPS for your volume. In a region that charges $0.065 per provisioned IOPS-month, you would be charged $1.083 for the IOPS that you provisioned ($0.065 per provisioned IOPS-month * 1000 IOPS provisioned * 43,200 seconds /(86,400 seconds /day * 30 day-month)).”
Other Aurora pricing components
Storage Rate $0.110 /GB/month (No price calculation examples given for Aurora storage and I/O)
I/O Rate $0.220 /1 million requests (Presuming IOPS equivalence / Aurora ratio noted from arch talk)
So this provides us with a common base, instance types that are equivalent between Aurora and EC2. All other Aurora instances types are different, so it’s not possible to do a direct comparison in those cases. Presumably we can make the assumption that the pricing ratio will similar for equivalent specs.
On Demand vs Reserved Instances
We realise we’re calculating on the basis of On Demand pricing. But we’re comparing pricing within AWS space, so presumably the savings for Reserved Instances are in a similar ballpark.
Other factors
We have 720 hours in a 30 day month, which is 2592000 seconds.
70% read/write ratio – 70% reads (used to calculate the effective Aurora IOPS)
10% read cache miss -10% cache miss rate on reads
Aurora I/O ratio: 3 (Aurora requiring 2 IOPS for a commit vs 6 in MySQL – even though this is a pile of extreme hogwash in terms of that pessimistic MySQL baseline)
We also spotted this note regarding cross-AZ Aurora traffic:
“Amazon RDS DB Instances inside VPC: For data transferred between an Amazon EC2 instance and Amazon RDS DB Instance in different Availability Zones of the same Region, Amazon EC2 Regional Data Transfer charges apply on both sides of transfer.”
So this would apply to application DB queries issued across an AZ boundary, which would commonly happen during failover scenarios. In fact, we know that this happens during regular operations with some EC2 setups, because the loadbalancing already goes cross-AZ. So that costs extra also. Now you know! (note: we did not factor this in to our calculations.)
Calculation Divergence
Our model comes up with identical outcomes for the examples Amazon provided, however it comes up 10-15% lower than Amazon’s calculator for specific Aurora configurations. We presume that the difference may lie in the calculated Aurora I/O rate, as that’s the only real “unknown” in the model. Amazon’s calculator does not show what formulae it uses for the sub-components, nor sub-totals, and we didn’t bother to tweak until we got at the same result.
It’s curious though, as the the architecture talk makes specific claims about Aurora’s I/O efficiency (which presume optimal Aurora situation and a dismal MySQL reference setup, something which I already raised in our initial Aurora post). So apparently the Amazon calculator assumes worse I/O performance than the technical architecture talk!
Anyhow, let’s just say our costing is conservative, as the actual cost is higher on the Aurora end.
Scenarios
Here we compare with say a MySQL/MariaDB Galera setup across 3 AZs running on EC2+EBS. While this should be similar in overall availability and read-capacity, note that
you can write to all nodes in a Galera cluster, whereas Aurora currently has a single writer/master;
When using the Amazon calculator, Aurora comes out at about double the EC2. But don’t take our word for it, do try this for yourself.
Currency Consequences
While pricing figures are distinct per country that Amazon operates in, the charges are always in USD. So this means that the indicated pricing is, in the end, in USD, and thus subject to currency fluctuations (if your default currency is not USD). What does this mean?
USD-AUD rate chart 2008-2018, from xe.com
So USD 1,000 can cost as little as AUD 906 or as much as AUD 1,653, at different times over the last 10 years. That’s quite a range!
Conclusion
As shown above, our calculation with Aurora MySQL shows it costing about twice as much. This is based on a reference MySQL/MariaDB+Galera with roughly the same scaling and resilience profile (e.g. the ability to survive DC outages). In functional terms, particularly with Aurora’s 30+second outage profile during failover, Galera comes out on top at half the cost.
So when is Aurora cheaper, as claimed by Amazon?
Amazon makes claims in the realm of “1/10th the cost”. Well, that may well be the case when comparing with the TCO of Oracle or MS SQL Server, and it’s fairly typical when comparing a proprietary system with an Open Source based one (mind again that Aurora is not actually Open Source as Amazon does not make their source code available, but it’s based on MySQL).
The only other way we see is to seriously compromise on the availability (resilience). In our second sample calculation, we use 2 instances per AZ. This is not primarily for performance, but so that application servers in an AZ don’t have to do cross-DC queries when one instance fails. In the case of Aurora, spinning up a new instance on the same dataset requires 15 minutes. So, do you want to take that hit? If so, you can save money there. If not, it’s still costly.
But hang on, if you’re willing to make the compromise on availability, you could reduce the Galera setup also, to only one instance per AZ. Yep!
So, no matter how you tweak it, Aurora is about twice the cost, with (in our opinion) a less interesting failover profile.
The Price of RDS Convenience
What you get with RDS/Aurora is the promise of convenience, and that’s what you pay for. But, mind that our comparison worked all within AWS space anyway, the EC2 instances we used for MySQL/MariaDB+Galera already use the same basic infrastructure, dashboard and management API as well. So you pay double just to go to RDS/Aurora, relative to building on EC2.
To us, that cost seems high. If you spend some, or even all that money on engineering that convenience around your particular setup, and even outsource that task and its maintenance, you get a nicer setup at the same or a lower cost. And last but not least, that cost will be more predictable – most likely the extra work will be charged in your own currency, too.
Cost Predictability and Budget
You can do a reasonable ball-park calculation of AWS EC2 instances that are always active, but EBS already has some I/O charges which make the actual cost rather more variable, and Aurora adds a few more variables on top of that. I’m still amazed that companies go for this, even though they traditionally prefer a known fixed cost (even if higher) over a variable cost. Choosing the variable cost breaks with some fundamental business rules, for the sake of some convenience.
The advantage of known fixed costs is that you can budget properly, as well as project future costs based on growth and other business factors. Purposefully ditching that realm, while exposing yourself to currency fluctuations at the same time, seems most curious. How do companies work this into their budgets? Because others do so? Well, following the neighbours is not always a good idea. In this case, it might be costly as well as financially risky.
In Amazon space, any EC2 or Service instance can “disappear” at any time. Depending on which service is affected, the service will be automatically restarted. In EC2 you can choose whether an interrupted instance will be restarted, or left shutdown.
For an Aurora instance, an interrupted instance is always restarted. Makes sense.
The restart timing, and other consequences during the process, are noted in our post on Aurora Failovers.
Aurora Testing Limitations
As mentioned earlier, we love testing “uncontrolled” failovers. That is, we want to be able to pull any plug on any service, and see that the environment as a whole continues to do its job. We can’t do that with Aurora, because we can’t control the essentials:
power button;
reset switch;
ability to kill processes on a server;
and the ability to change firewall settings.
In Aurora, an instance is either running, or will (again) be running shortly. So that we know. Aurora MySQL also offers some commands that simulate various failure scenarios, but since they are built-in we can presume that those scenarios are both very well tested, as well as covered by the automation around the environment. Those clearly defined cases are exactly the situations we’re not interested in.
What if, for instance, a server accepts new connections but is otherwise unresponsive? We’ve seen MySQL do this on occasion. Does Aurora catch this? We don’t know and we have no way of testing that, or many other possible problem scenarios. That irks.
The Need to Know
If an automated system is able to catch a situation, that’s great. But if your environment can end up in a state such as described above and the automated systems don’t catch and handle it, you could be dead in the water for an undefined amount of time. If you have scripts to catch cases such as these, but the automated systems catch them as well, you want to be sure that you don’t trigger “double failovers” or otherwise interfere with a failover-in-progress. So either way, you need to know and and be aware whether a situation is caught and handled, and be able to test specific scenarios.
In summary: when you know the facts, then you can assess the risk in relation to your particular needs, and mitigate where and as desired.
A corporate guarantee of “everything is handled and it’ll be fine” (or as we say in Australia “She’ll be right, mate!“) is wholly unsatisfactory for this type of risk analysis and mitigation exercise. Guarantees and promises, and even legal documents, don’t keep environments online. Consequently, promises and legalities don’t keep a company alive.
So what does? In this case, engineers. But to be able to do their job, engineers need to know what parameters they’re working with, and have the ability to test any unknowns. Unfortunately Aurora is, also in this respect, a black box. You have to trust, and can’t comprehensively verify. Sigh.
Right now Aurora only allows a single master, with up to 15 read-only replicas.
Master/Replica Failover
We love testing failure scenarios, however our options for such tests with Aurora are limited (we might get back to that later). Anyhow, we told the system, through the RDS Aurora dashboard, to do a failover. These were our observations:
Role Change Method
Both master and replica instances are actually restarted (the MySQL uptime resets to 0).
This is quite unusual these days, we can do a fully controlled role change in classic asynchronous replication without a restart (CHANGE MASTER TO …), and Galera doesn’t have read/write roles as such (all instances are technically writers) so it doesn’t need role changes at all.
Failover Timing
Failover between running instances takes about 30 seconds. This is in line with information provided in the Aurora FAQ.
Failover where a new instance needs to be spun up takes 15 minutes according to the FAQ (similar to creating a new instance from the dash).
Instance Availability
During a failover operation, we observed that all connections to the (old) master, and the replica that is going to be promoted, are first dropped, then refused (the connection refusals will be during the period that the mysqld process is restarting).
According to the FAQ, reads to all replicas are interrupted during failover. Don’t know why.
Aurora can deliver a DNS CNAME for your writer instance. In a controlled environment like Amazon, with guaranteed short TTL, this should work ok and be updated within the 30 seconds that the shortest possible failover scenario takes. We didn’t test with the CNAME directly as we explicitly wanted to observe the “raw” failover time of the instances themselves, and the behaviour surrounding that process.
Caching State
On the promoted replica, the buffer pool is saved and loaded (warmed up) on the restart; good! Note that this is not special, it’s desired and expected to happen: MySQL and MariaDB have had InnoDB buffer pool save/restore for years. Credit: Jeremy Cole initially came up with the buffer pool save/restore idea.
On the old master (new replica/slave), the buffer pool is left cold (empty). Don’t know why. This was a controlled failover from a functional master.
Because of the server restart, other caches are of course cleared also. I’m not too fussed about the query cache (although, deprecated as it is, it’s currently still commonly used), but losing connections is a nuisance. More detail on that later in this article.
Statistics
Because of the instance restarts, the running statistics (SHOW GLOBAL STATUS) are all reset to 0. This is annoying, but should not affect proper external stats gathering, other than for uptime.
On any replica, SHOW ENGINE INNODB STATUS comes up empty. Always. This seems like obscurity to me, I don’t see a technical reason to not show it. I suppose that with a replica being purely read-only, most running info is already available through SHOW GLOBAL STATUS LIKE ‘innodb%’, and you won’t get deadlocks on a read-only slave.
Multi-Master
Aurora MySQL multi-master was announced at Amazon re:Invent 2017, and appears to currently be in restricted beta test. No date has been announced for general availability.
We’ll have to review it when it’s available, and see how it works in practice.
Conclusion
Requiring 30 seconds or more for a failover is unfortunate, this is much slower than other MySQL replication (writes can failover within a few seconds, and reads are not interrupted) and Galera cluster environments (which essentially delivers continuity across instance failures – clients talking to the failed instance will need to reconnect to the loadbalancer/cluster to continue).
I don’t understand why the old master gets a cold InnoDB buffer pool.
I wouldn’t think a complete server restart should be necessary, but since we don’t have insight in the internals, who knows.
On Killing Connections (through the restart)
Losing connections across an Aurora cluster is a real nuisance that really impacts applications. Here’s why:
When MySQL C client library (which most MySQL APIs either use or are modelled on) is disconnected, it passes back a specific error to the application. When the application makes its next query call, the C client will automatically reconnect first (so the client does not have to explicitly reconnect). So a client only needs to catch the error and re-issue its last command, and all will generally be fine. Of course, if it relies on different SESSION settings, or was in the middle of a multi-statement transaction, it will need to do a bit more.
So, this means that the application has to handle disconnects gracefully without chucking hissy-fits at users, and I know for a fact that that’s not how many (most?) applications are written. Consequently, an Aurora failover will make the frontend of most applications look like a disaster zone for about 30 seconds (provided functional instances are available for the failover, which is the preferred and best case scenario).
I appreciate that this is not directly Aurora’s fault, it’s sloppy application development that causes this, but it’s a real-world fact we have to deal with. And, perhaps importantly: other cluster and replication options do not trigger this scenario.
Our clients operate on a variety of platforms, and RDS (Amazon Relational Database Service) Aurora has received quite a bit of attention in recent times. On behalf of our clients, we look beyond the marketing, and see what the technical architecture actually delivers. We will address specific topics in individual posts, this time checking out what the Aurora architecture means for write and caching behaviour (and thus performance).
What is RDS Aurora?
First of all, let’s declare the baseline. MySQL Aurora is not a completely new RDBMS. It comprises a set of Amazon modifications on top of stock Oracle MySQL 5.6 and 5.7, implementing a different replication mechanism and some other changes/additions. While we have some information (for instance from the “deep dive” by AWS VP Anurag Gupta), the source code of the Aurora modifications are not published, so unfortunately it is not immediately clear how things are implemented. Any architecture requires choices to be made, trade-offs, and naturally these have consequences. Because we don’t get to look inside the “black box” directly, we need to explore indirectly. We know how stock MySQL is architected, so by observing Aurora’s behaviour we can try to derive how it is different and what it might be doing. Mind that this is equivalent to looking at a distant star, seeing a wobble, and deducing from the pattern that there must be one or more planets orbiting. It’s an educated guess.
For the sake of brevity, I have to skip past some aspects that can be regarded as “obvious” to someone with insight into MySQL’s architecture. I might also defer explaining a particular issue in depth to a dedicated post on that topic. Nevertheless, please do feel free to ask “so why does this work in this way”, or other similar questions – that’ll help me check my logic trail and tune to the reader audience, as well as help create a clearer picture of the Aurora architecture.
Instead of using the binary log, Aurora replication ties into the storage layer. It only supports InnoDB, and instead of doing disk reads/writes, the InnoDB I/O system talks to an Amazon storage API which delivers a shared/distributed storage, which can work across multiple availability zones (AZs). Thus, a write on the master will appear on the storage system (which may or may not really be a filesystem). Communication between AZs is fairly fast (only 2-3 ms extra overhead, relative to another server in the same AZ) so clustering databases or filesystems across AZs is entirely feasible, depending on the commit mechanism (a two-phase commit architecture would still be relatively slow). We do multi-AZ clustering with Galera Cluster (Percona XtraDB Cluster or MariaDB Galera Cluster). Going multi-AZ is a good idea that provides resilience beyond a single data centre.
So, imagine an individual instance in an Aurora setup as an EC2 (Amazon Elastic Computing) instance with MySQL using an SSD EBS (Amazon Elastic Block Storage) volume, where the InnoDB I/O threads interface more directly the the EBS API. The actual architecture might be slightly different still (more on that in a later post), but this rough description helps set up a basic idea of what a node might look like.
Writes in MySQL
In a regular MySQL, on commit a few things happen:
the InnoDB log is written to and flushed,
the binary log is written to (and possibly flushed), and
the changed pages (data and indexes) in the InnoDB buffer pool are marked dirty, so a background thread knows they need to be written back to disk (this does not need to happen immediately). When a page is written to disk, normally it uses a “double-write” mechanism where first the original page is read and written to a scratch space, and then the new page is put in the original position. Depending on the filesystem and underlying storage (spinning disk, or other storage with different block size from InnoDB page size) this may be required to be able to recover from write fails.
This does not translate in to as many IOPS because in practice, transaction commits are put together (for instance with MariaDB’s group commit) and thus many commits that happen in a short space effectively only use a few IOs for their log writes. With Galera cluster, the local logs are written but not flushed, because the guaranteed durability is provided with other nodes in the cluster rather than local persistence of the logfile.
In Aurora, a commit has to send either the InnoDB log entries or the changed data pages to the storage layer; which one it is doesn’t particularly matter. The storage layer has a “quorum set” mechanism to ensure that multiple nodes accept the new data. This is similar to Galera’s “certification” mechanism that provides the “virtual synchrony”. The Aurora “deep dive” talk claims that it requires many fewer IOPS for a commit; however, it appears they are comparing a worst-case plain MySQL scenario with an optimal Aurora environment. Very marketing.
Aurora does not use the binary log, which does make one wonder about point-in-time recovery options. Of course, it is possible to recover to any point-in-time from an InnoDB snapshot + InnoDB transaction logs – this would require adding timestamps to the InnoDB transaction log format.
While it is noted that the InnoDB transaction log is also backed up to S3, it doesn’t appear to be used directly (so, only for recovery purposes then). After all, any changed page needs to be communicated to the other instances, so essentially all pages are always flushed (no dirty pages). When we look at the InnoDB stats GLOBAL STATUS, we sometimes do see up to a couple of dozen dirty pages with Aurora, but their existence or non-existence doesn’t appear to have any correlation with user-created tables and data.
Where InnoDB gets its Speed
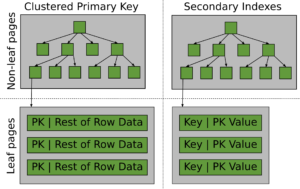
InnoDB rows and indexing
We all know that disk-access is slow. In order for InnoDB to be fast, it is dependent on most active data being in the buffer pool. InnoDB does not care for local filesystem buffers – something is either in persistent storage, or in the buffer pool. In configurations, we prefer direct I/O so the system calls that do the filesystem I/O bypass the filesystem buffers and any related overhead. When a query is executed, any required page that’s not yet in the buffer pool is requested to be loaded in the background. Naturally, this does slow down queries, which is why we preferably want all necessary pages to already be in memory. This applies for any type of query. In InnoDB, all data/indexes are structured in B+trees, so an INSERT has to be merged into a page and possibly causes pages to be split and other items shuffled so as to “re-balance” the tree. Similarly, a delete may cause page merges and a re-balancing operation. This way the depth of the tree is controlled, so that even for a billion rows you would generally see a depth of no more than 6-8 pages. That is, retrieving any row would only require a maximum of 6-8 page reads (potentially from disk).
I’m telling you all this, because while most replication and clustering mechanisms essentially work with the buffer pool, Aurora replication appears to works against it. As I mentioned: choices have consequences (trade-offs). So, what happens?
Aurora Replication
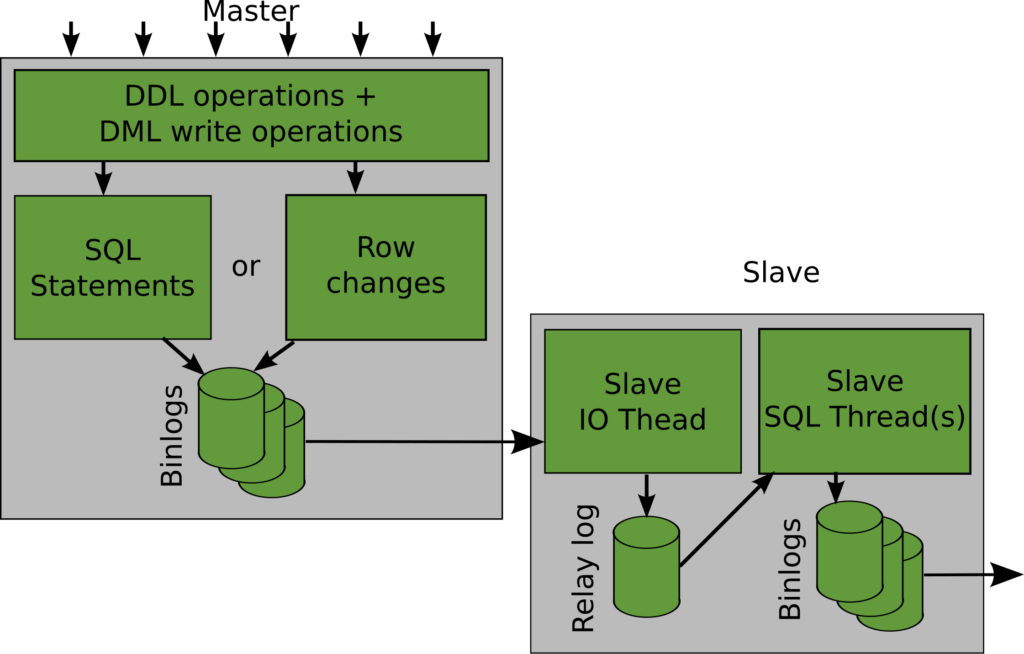
When you do a write in MySQL which gets replicated through classic asynchronous replication, the slaves or replica nodes affect the row changes in memory. This means that all the data (which is stored with the PRIMARY KEY, in InnoDB) as well as any other indexes are updated, the InnoDB log is written, and the pages marked as dirty. It’s very similar to what happens on the writer/master system, and thus the end result in memory is virtually identical. While Galera’s cluster replication operates differently from the asynchronous mechanism shown in the diagram, the resulting caching (which pages are in memory) ends up similar.
MySQL Replication architecture
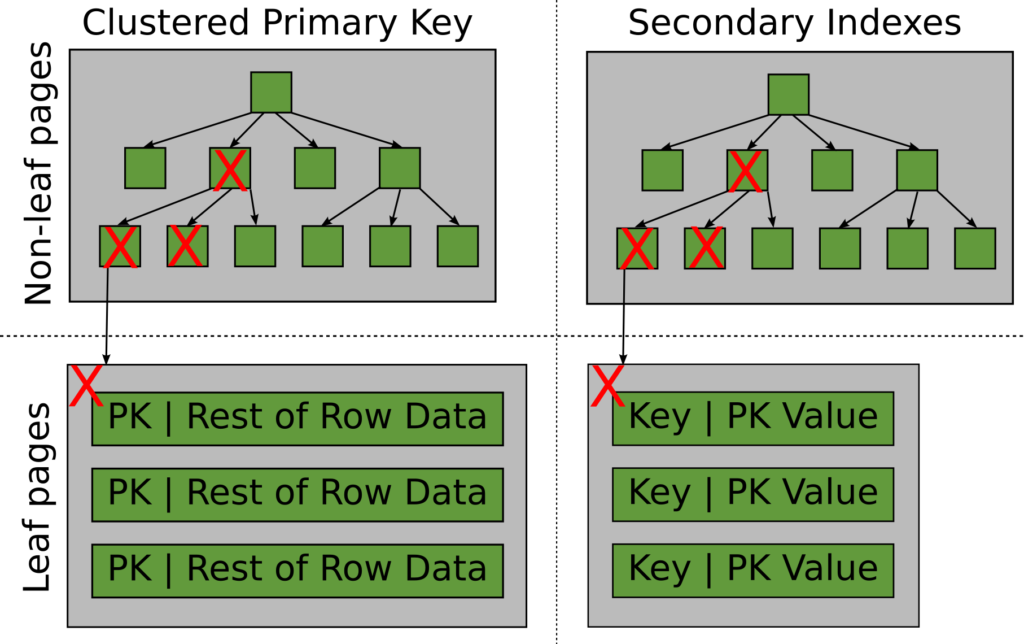
Not so with Aurora. Aurora replicates in the storage layer, so all pages are updated in the storage system but not in the in-memory InnoDB buffer pool. A secondary notification system between the instances ensures that cached InnoDB pages are invalidated. When you next do a query that needs any of those no-longer-valid cached pages, they will have to be be re-read from the storage system. You can see a representation of this in the diagram below, indicating invalidated cache pages in different indexes; as shown, for INSERT operations, you’re likely to have pages higher up in the tree and one sideways page change as well because of the B+tree-rebalancing.
Aurora replicated insert
The Chilling Effect
We can tell the replica is reading from storage, because the same query is much slower than before we did the insert from the master instance. Note: this wasn’t a matter of timing. Even if we waited slightly longer (to enable a possible background thread to refresh the pages) the post-insert query was just as slow.
Interestingly, the invalidation process does not actually remove them from the buffer pool (that is, the # of pages in the buffer pool does not go down); however, the # of page reads does not go up either when the page is clearly re-read. Remember though that a status variable is just that, it has to be updated to be visible and it simply means that the new functions Amazon implemented don’t bother updating these status variables. Accidental omission or purposeful obscurity? Can’t say. I will say that it’s very annoying when server statistics don’t reflect what’s actually going on, as it makes the stats (and their analysis) meaningless. In this case, the picture looks better than it is.
With each Aurora write (insert/update/delete), the in-memory buffer pool on replicas is “chilled”.
Unfortunately, it’s not even just the one query on the replica that gets affected after a write. The primary key as well as the secondary indexes get chilled. If the initial query uses one particular secondary index, that index and the primary key will get warmed up again (at the cost of multiple storage system read operations), however the other secondary indexes are still chattering their teeth.
Being Fast on the Web
In web applications (whether websites or web-services for mobile apps), typically the most recently added data is the most likely to be read again soon. This is why InnoDB’s buffer pool is normally very effective: frequently accessed pages remain in memory, while lesser used ones “age” and eventually get tossed out to make way for new pages.
Having caches clear due to a write, slows things down. In the MySQL space, the fairly simply query cache is a good example. Whenever you write to table A, any cached SELECTs that accesses table A are cleared out of the cache. Regardless of whether the application is read-intensive, having regular writes makes the query cache useless and we turn it off in those cases. Oracle has already deprecated the “good old” query cache (which was introduced in MySQL 4.0 in the early 2000s) and soon its code will be completely removed.
Conclusion
With InnoDB, you’d generally have an AUTO_INCREMENT PRIMARY KEY, and thus newly inserted rows are sequenced to that outer end of the B+Tree. This also means that the next inserted row often ends up in the same page, again invalidating that recently written page on the replicas and slowing down reads of any of the rows it contained.
For secondary indexes, the effect is obviously scattered although if the indexed column is temporal (time-based), it will be similarly affected to the PRIMARY KEY.
How much all of this slows things down will very much depend on your application DB access profile. The read/write ratio will matter little, but rather whether individual tables are written to fairly frequently. If they do, SELECT queries on those tables made on replicas will suffer from the chill.
Aurora uses SSD EBS so of course the storage access is pretty fast. However, memory is always faster, and we know that that’s important for web application performance. And we can use similarly fast SSD storage on EC2 or another hosting provider, with mature scaling technologies such as Galera (or even regular asynchronous multi-threaded replication) that don’t give your caches the chills.
Even with SSD becoming more prolific for local-ish storage even on cloud servers, we still encounter attached storage (SAN) quite frequently. This can be fine, but we often find that the performance of SANs is quite dismal.
SANs are very efficient with bulk sequential reads or writes, which a database server of course doesn’t care about;
SANs often have a large memory cache (sometimes with intermediate SSD), optimising frequent reads – again a database server won’t benefit from this, because it will already have any recent data in its own caches (for MySQL/MariaDB, that’d typically be the InnoDB Buffer Pool). So usually any database disk read needs to access physical storage = slow;
SANs will cache data writes in (battery backed) memory. That can work fine, provided they respond quickly enough.
Slow response on that last aspect can really damage performance. But we need a reference point.
So let’s compare with a fairly fast spinning HDD, 15000 RPM. That sounds like a lot, but 15000 RPM / 60 seconds = only 250 spins per second. It gets slightly better, but not that much: even presuming the disk is at the correct cylinder already (let’s hope it is because disk seeks are measured in milliseconds which is, relatively, really slow) to write to the InnoDB log file, you will -on average- still have an overhead of 1/2 round of the disk to get the head to the right point so you can write. So you’ll get at most 500 writes per second.
Anyway, that’s spinning disk performance in an optimal situation. You’d expect an expensive SAN to deliver higher write/fsync performance than that, right? So, you may well expect that, but you prepare to be disappointed. We often see performance in the range of 500-600.
InnoDB tries to combine commits when it writes to and fsyncs the InnoDB log file, so that helps a bit. We also see some SANs that do wonderfully well with numbers in the thousands, and of course local SSDs that easily do close to ten thousand and higher.
Just be aware that expensive “enterprise” hardware does not necessarily help database performance.
If you need assistance with recommendations for infrastructure design, or measuring on existing systems, contact Open Query.
Right now we’re volunteering some engineering time to assisting the WordPress and WooCommerce people with scalability issues. In the past we’ve put similar efforts into Drupal.
There are many opinions on these systems out there, most of them sadly negative. We take a different view. Each of these frameworks obviously has their advantages and disadvantages, but the key question is why people use them. When we understand that, we can assess that reasoning, and assist further.
Obviously writing your own code all the way is going to potentially create the most optimal result for your site. A custom tool is going to be less code and more optimal for your situation. However, it also requires you to put in quite a bit of development effort both to create and to maintain that system, including security issues. When you’re big enough (as a site/company) this can be worthwhile, but more and more organisations actually appear to be moving towards utilising a CMS and then extending that to their needs using the usual module/plugin/extension model.
This also means that bigger and bigger sites use these systems, and thus we need to look at the scalability. CMS frameworks tend to be “db heavy”, caused by being highly configurable combined with a modular/abstraction architecture that sometimes goes for “code architectural correctness” without taking scaling into account. Naturally most such code works fine on a dev box and even on a modest live server. But add sufficient content, and things rapidly go downhill. Just like with other database related tuning issues, there is no gradual degradation in performance – when certain boundaries are reached, performance plummets to cause nasty page load times or even complete page load failures.
Are these systems inherently dreadful? Actually, no. They do a darn good job and even in security terms they’re not bad at all. Naturally one always has to be careful with modules/plugins and whether they are (still) maintained.
So, with that assessment out of the way – we can look at the actual issues. It makes sense for us to contribute to these systems as it directly benefits our clients, ourselves, and many many others.
Just no the option structure in WordPress has drawn our interest. It’s abstracted, and so a plugin will request the value of an individual option item (by name). Typically it causes a db query. WordPress has an ‘autoload’ mechanism particularly for its core settings, which it loads in one bigger query and caches – that makes sense.
We’ve just commented on an existing issue regarding the indexing of the autoload column, with people arguing that indexing a boolean field is not beneficial (not necessarily true and easily tested for a specific case – the outcomes is that in this case an index IS beneficial) and that having more indexes slows down writes (true of course, but that’s never an argument against proper indexing – also this is mostly a read table, so a bit of overhead on writes is fairly immaterial). Lastly there were comments re MyISAM which has a slightly different performance profile to InnoDB when testing this. But InnoDB has been the default engine for quite a few years now – any installation in recent years, and any installation where the owner needs to care for more performance and other factors, will already be using InnoDB. Taking MyISAM into account is not beneficial. We hope the index will shortly be added. In the mean time you can add it yourself:
ALTER TABLE wp_options ADD INDEX (autoload)
Using autoload for everything would not be efficient, there can be tens of thousands of options in a decently sized site. So we see plugins retrieve half a dozen options, one by one using the appropriate framework function, and each triggers a database query. Again we have to appreciate why this architecture is the way it is, and not waste time on arguing with that. There are sensible reasons for having such an option architecture. What we need to address is the inefficiency of triggering many queries.
Our proposal is to extend the get_option() function with an extra parameter for a plugin name (call it a domain), then the function can issue a single db query to retrieve all the options for that plugin and cache it in a single object. When another option is requested it can be retrieved from there rather than triggering another query. This reduces the number of db queries from N per plugin to 1, which is significant. Mind you, each of these queries is tiny and doesn’t require much lookup time. But running any query has intrinsic overhead so we want to reduce the number of queries whenever possible – not running superfluous queries, combining queries, and so on.
There are variations on the proposal as there are many aspects to consider, but it’s important to not leave it “as is” as currently it affects performance and scalability.
So how do we catch potential items of interest? On the database end, the slow query log is still very useful with the proper settings. log_queries_not_using indexes, min_examined_row_limit=1000 (tune appropriate for the environment), log_slow_filter and log_slow_verbosity to give as much info as possible, and long_query_time to something sub-second. Naturally, this presumes you’ve already taken care of real nasties otherwise you’ll get very big slow log files very quickly. You can analyse the slow query log using Percona Tools, but the ‘mysqldumpslow’ tool which is part of the server package is pretty useful also. You’re looking for queries that either take a long time, or that happen often, or just look odd/inefficient/unnecessary. Then hunt where they come from in the code, and figure out the why. Often reasons aren’t necessarily good or current (historical scenarios linger), but there will be reasons and understanding them will help you talk with developers more effectively – seeing where they come from.
WordPress has a nice plugin called Query Monitor. As admin you get details from a page load in your top admin bar, and you can delve into specific aspects. Things to look out for are an excessive number of queries for a page (a hundred is sadly common, but when you see into the thousands it’s worthwhile investigating – of course, start with the biggest problems first and work your way down), duplicated queries (indicating framework inefficiencies) and things like that. Have a good browse around, there’s much there that’s useful.
If you want, feel free to bring suspected issues to our attention. We’ll look at them, perhaps write about them here, and in any case follow up with the developers in their bug tracking system. It’s worthwhile.

 FastCGI has many advantages, and it’s our preferred interface when it’s available for the required script language (such as PHP). However, we generally see environments where the php-fpm processes (for instance) are run on the same system as the web server, even though that’s not necessary. In FastCGI space, the web server (say nginx) passes a request through a socket or TCP/IP address:port, and the application delivers back an response (web page, web service JSON result, etc). Obviously sockets only work locally, but the port can be on another machine.
 I promised to do a pricing post on the Amazon RDS Aurora MySQL pricing, so here we go. All pricing is noted in USD (we’ll explain why)
 In Amazon space, any EC2 or Service instance can “disappear” at any time. Depending on which service is affected, the service will be automatically restarted. In EC2 you can choose whether an interrupted instance will be restarted, or left shutdown.
 Right now Aurora only allows a single master, with up to 15 read-only replicas.