
While there are many graphing tools out there and we’ve used Munin for a while now.
The MySQL plugin for Munin had fallen out of date and the show engine innodb status output changed in 5.5 making some bits of the plugin simply not work any more. Also the show global status has some extra variables so there was a need to create new graphs.
All of these are now in the 2.1.8+ development releases of Munin.
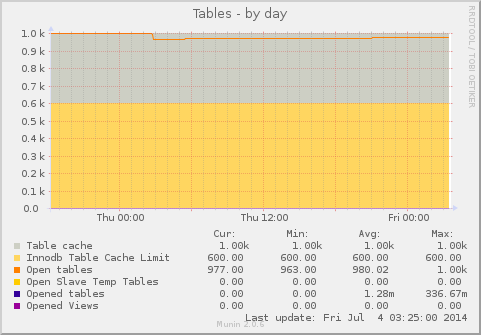
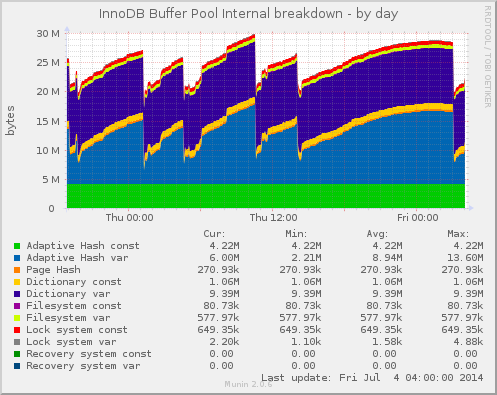
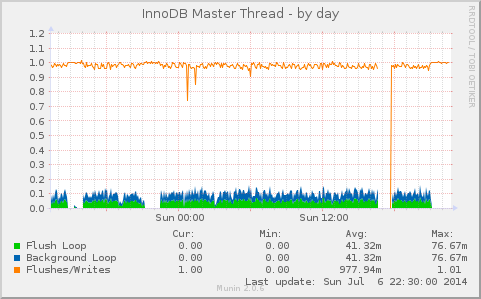
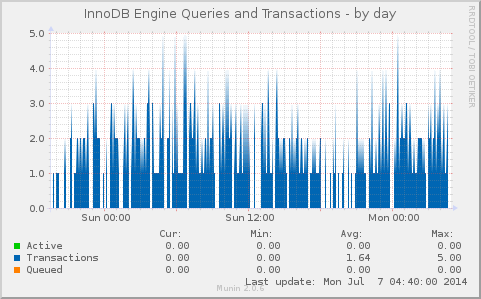
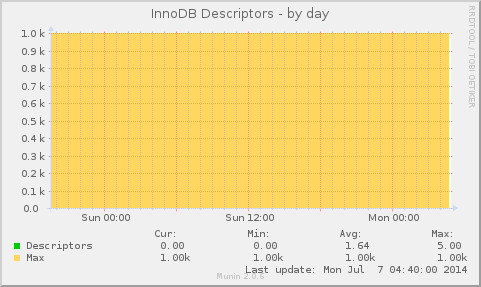
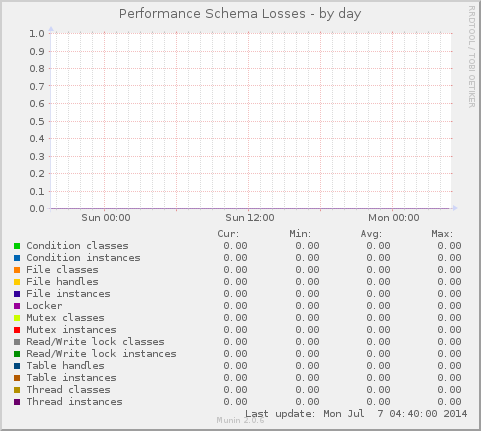
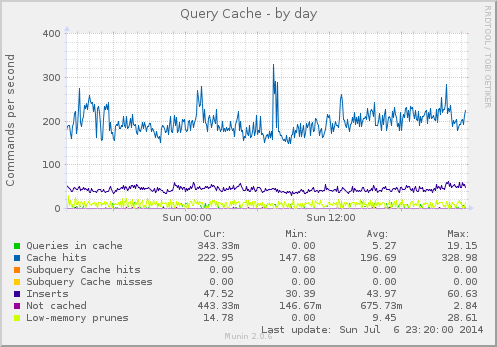
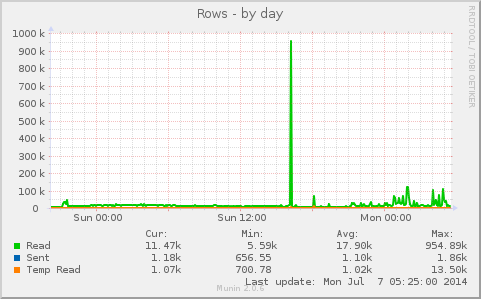
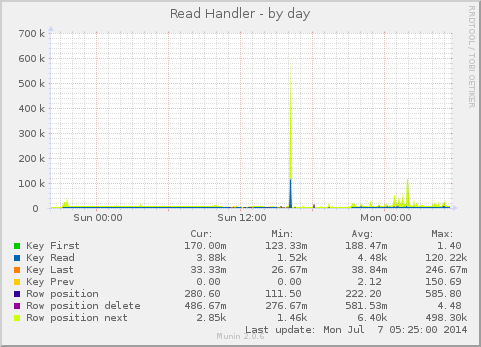
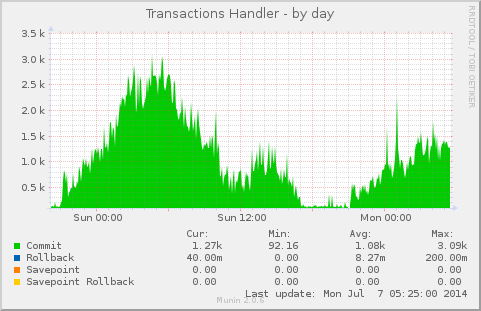
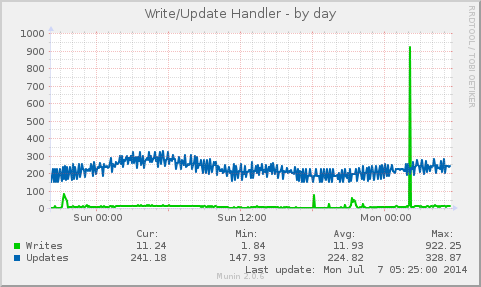
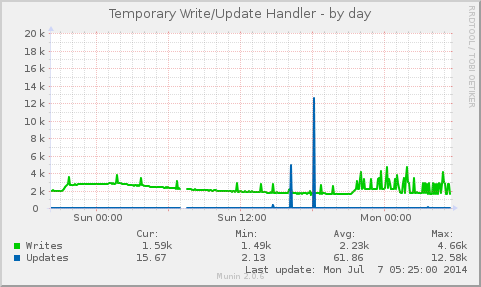
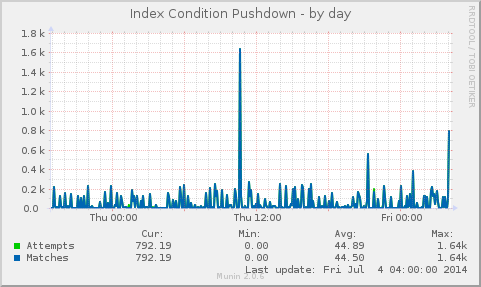
Here are samples of the new/updated graphs.

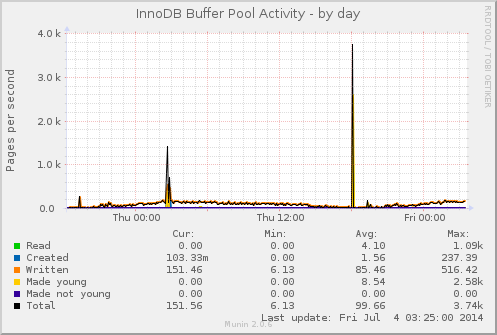
Innodb Buffer Pool Activity


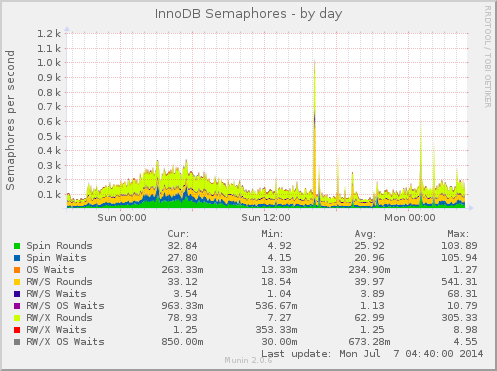


Some of these above graphs may miss a variable or two with MariaDB-10 because of variable name changes. These will be corrected when we get to those. In MariaDB-10 there is useful transition to information schema tables for status information which will make it significantly easier to parse.
Individual buffer pool information also has been parsed out however we haven’t worked out how to graphing this correctly. Also not yet merged is a bunch of Galera graphs which are currently waiting on some Galera provider changes.
We’ll continue to work with the Munin developers to keep this MySQL plugin up to date and useful.
There’s other graphs in the MySQL Munin plugins that we haven’t changed so aren’t included here.
Please have a look at https://github.com/kjellm/munin-mysql
I’ve used that plugin for Munin for a couple of years now, and have added quite a few graphs myself for use with Percona Server and Galera.
As the original author of the upstream mysql plugin Kjell-Magne Øierud set a good foundation for the plugin. Looking at the current difference I can see there isn’t most of graphs here and does have maatkit/pt_heartbeat, and pulls some state data from the process list which looks interesting.
The contrib module for Galera is what I based my yet to be merged bits on. Waiting on https://github.com/codership/galera/pull/57 and https://github.com/codership/galera/pull/50. The CacheEfficiency module also is a good example of CDEF functions so I’ll probably look at that again.
Thanks for posting Mrten.