Posted on 2 Comments

Munin graphing of MySQL

While there are many graphing tools out there and we’ve used Munin for a while now.

The MySQL plugin for Munin had fallen out of date and the show engine innodb status output changed in 5.5 making some bits of the plugin simply not work any more. Also the show global status has some extra variables so there was a need to create new graphs.

All of these are now in the 2.1.8+ development releases of Munin.

Here are samples of the new/updated graphs.

mysql2_tables-day
Tables
Munin table definations
Table Definitions
mysql2_innodb_bpool_act-day

Innodb Buffer Pool Activity
mysql_innodb_bpool_internal_breakdown-day
Innodb Buffer Pool Internal Breakdown
Innodb Insert Buffer
mysql_innodb_bpool-day
Innodb Buffer Pool
Innodb Semaphores
Innodb Semaphores
Innodb Master Thread
mysql_innodb_adaptive_hash-day
Innodb Adaptive Hash Index
Innodb Queries and Transactions
Innodb Read Views
Innodb Read Views
Innodb Descriptors
Innodb Descriptors
Performance Schema Losses
Query Cache
Query Cache
Maximum Memory of MySQL
Rows
Rows
Handler Read
Handler Read
Handler Transaction
Handler Transaction
Handler Write
Handler Write
Handler Temporary Write/Updates
mysql2_execution-day
Execution (triggers and events)
mysql_icp-day
Index Condition Pushdown
Multi Range Read Optimizations

Some of these above graphs may miss a variable or two with MariaDB-10 because of variable name changes. These will be corrected when we get to those. In MariaDB-10 there is useful transition to information schema tables for status information which will make it significantly easier to parse.

Individual buffer pool information also has been parsed out however we haven’t worked out how to graphing this correctly. Also not yet merged is a bunch of Galera graphs which are currently waiting on some Galera provider changes.

We’ll continue to work with the Munin developers to keep this MySQL plugin up to date and useful.

There’s other graphs in the MySQL Munin plugins that we haven’t changed so aren’t included here.

Posted on 2 Comments
Posted on

SPDY protocol available in nginx 1.4

Nginx 1.4 can now do SPDY (draft 2). It’s hiding away in a separate file http://nginx.org/en/docs/http/ngx_http_spdy_module.html

So what is SPDY? In a nutshell, it does multiplexing, prioritization and compression of HTTP/HTTPS requests over a single TCP/IP connection. It also enables the server to push data before requested. These enable a browser or web services client to obtain multiple responses quickly by opening and authenticating a single connection to a web server and then issue multiple requests in parallel (well, whenever it wants, but in any case not requiring additional the completion of one request before the next request and not requiring, though still possible, multiple TCP/IP concurrent connections). For more info on SPDY, see http://www.chromium.org/spdy/spdy-protocol.

There is also an Apache 2.2 module for SPDY (https://code.google.com/p/mod-spdy/). Browser support for SPDY is present in Firefox, Chrome, the default Android web browser, and Opera.

If you have production experience with SPDY, good or bad, we’d like to hear about it! Particularly since SPDY is still relatively new and not yet used everywhere, the more information is published, the better.

edit: official docs are up.

Posted on
Posted on 1 Comment

Web Logs and Statistics

I’ve previously covered how user perspective and that browser to web server latency is a dominate cause of web server performance issues.

Assuming you’ve resolved those as best as you can how to you measure server performance at a per request level. Web servers allow you to put their processing time into the logs however its not there by default.

Using Nginx you can define a custom format by adding $request_time:

log_format extended '$remote_addr - $remote_user [$time_local]  '
                    '"$request" $status $request_time $body_bytes_sent '
                    '"$http_referer" "$http_user_agent"';

access_log [current access log file] extended;

In Apache’s HTTPd you can do a similar thing using %D:

LogFormat "%h %l %u %t \"%r\" %>s %D %b \"%{Referer}i\" \"%{User-agent}i\"" extended

CustomLog [current access log file] extended

After you’ve collected a meaningful sample of web activity you’re ready to analyse. First step copy the logs off all web servers to a common directory.

Second combine the logs. Assuming you haven’t played with the time format in the log, logmerge using –apache-access is a good way to get a single log even with the Nginx format above.

logmerge --apache-access *access.log > weball.log

Assuming your time is in the 10th column like I’ve done in the example. The following will put the slowest responses at the top.

sort -n -r -k 10 --parallel=8 weball.log > weball-sort.log

Take a look though and look at what’s here.

If you consider more that 4 seconds for a response is slow lets move all those requests to their own file. The grep here is matching the first response of 0, 1, 2 or 3 seconds in the sorted log.

grep -n -m 1 'HTTP/1\.[01]" 200 [0123]\.' weball-sort.log

42435:127.0.0.1 - - [02/Oct/2012:22:24:33 -0400] "POST /search ...

This will print the first line that has a response time beginning with 0,1,2 or 3. Because its sorted all lines before this are bigger. So lets put that in its own file.

head -n {linenumber - 1} weball-sort.log > weball-sort-more-than-4-seconds.log

To group these by URL path and get some frequency counts:

cut -f 8 -d ' ' web-access-sorted-time-more-than-4-seconds.log | sort | uniq -c | sort -n -r

6377 /new-releases
3753 /userrecommendations/index
2160 /home
1073 /bestsellers/reviewed
1048 /myfantasicproduct
563 /category/cool/10
464 /category/fun/17
395 /index.php?do=/blog/add/

....

From this you should start to recognise some URL patterns that need attention.

Take a note of these. And we’ll use statistics to see how these really are across all logs. I didn’t find a good simple number counter quickly enough so I’m using the modified one as attached. Compile with gcc stat.c -o stat -lm. This should compile on any ansi C compiler. It takes numbers as the input and calculates output when the EOF is reached.

/* stat.c
* This program reads numbers from standard input and outputs
* sum, mean and standard deviation.
*
* Rewritten by Daniel Black of Open Query
*
* To build:
* gcc stat.c -o stat -lm
*
* originally based of:
* http://www.dreamincode.net/forums/topic/138734-sum-mean-median-max-min-standard-deviation-in-c/
*/

#include <stdio.h>
#include <stdlib.h>
#include <math.h>
#include <string.h>

int main(void)
{
long unsigned count = 0;
double sum_sqrs = 0, total = 0, max = 0, min = 0, mean = 0, std_dev = 0, var = 0;
int res = 0;
float tmp;

/* Read inputs from the console window */
res = scanf("%f", &tmp);

if (res == EOF) return 0;
count = 1;
min = max = total = tmp;
sum_sqrs = tmp * tmp;

while(1)
{
res = scanf("%f", &tmp);
if (res == EOF) break;
count += res;

if(tmp < min) min = tmp;
if(tmp > max) max = tmp;

total += tmp;
sum_sqrs += tmp * tmp;
}

printf("Count: %lu\n", count);
printf("Sum of All Values: %.2f: \n", total);

mean = total / count;
printf("Mean of Values: %.2f: \n", mean);

printf("Minimum value entered: %.2f: \n", min);
printf("Maximum value entered: %.2f: \n", max);

var = sum_sqrs / count - mean*mean;
std_dev = sqrt(var);

printf("Standard Deviation: %.2f\n", std_dev);

return 0;
}

So:

fgrep "GET /home" weball.log | cut -f 11 -d ' ' | ./stat
Count: 47438
Sum of All Values: 69947.67:
Mean of Values: 1.47:
Minimum value entered: 0.00:
Maximum value entered: 200.00:
Standard Deviation: 1.83

Assuming this is a normal like distribution 97% of responses will lie within mean + 2* standard deviation so 5.13 seconds. Acceptable? up to you.

There’s still a 200 second maximum on this. Though there shouldn’t be that many outlying entries we’ll need to look at this to see its significance.

How many took more than 10 seconds?

fgrep 'GET /home' web-access-sorted-time-slowest-40000.log| egrep -v 'HTTP/1\.[01]" [0-9]{3} [0-9]\.' | wc -l

61

So 61 request out of 47438? Using “more” instead of “wc -l” will enable you to see some responses. Sometimes it a property of the dataset that causes these particular pages to be slow so even a particularly low number here may be worth examining.

Repeating the above steps for other URLs is a pretty good way of identifying problem pages by examining the frequency, mean, standard deviation and the business value of the page. So now you just need to dive into the mechanics of the page and work out what’s being slow.

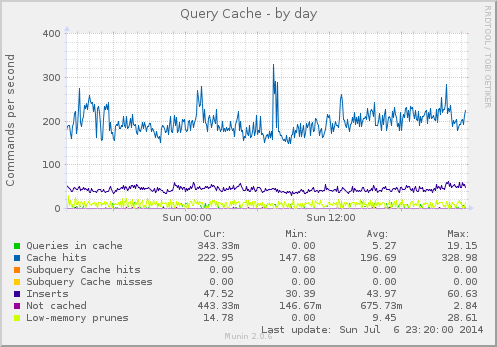
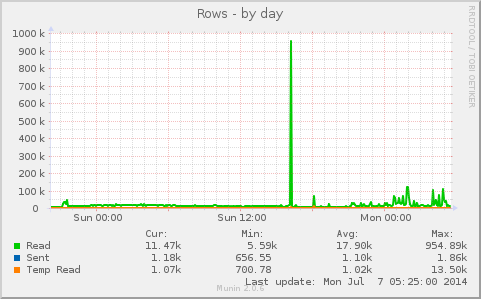
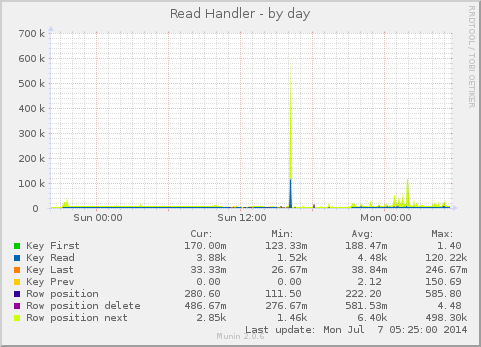
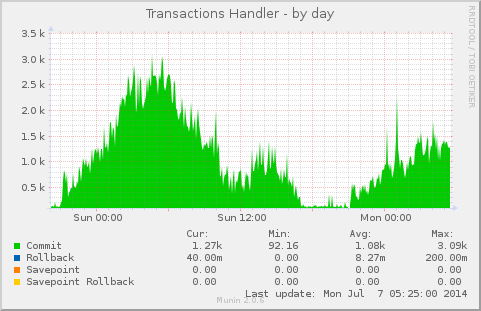
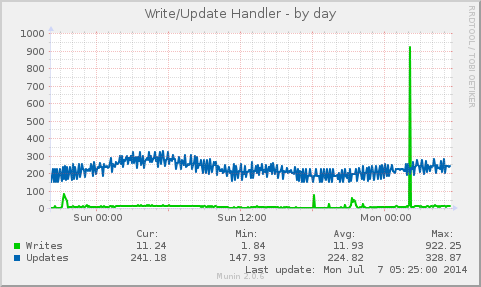
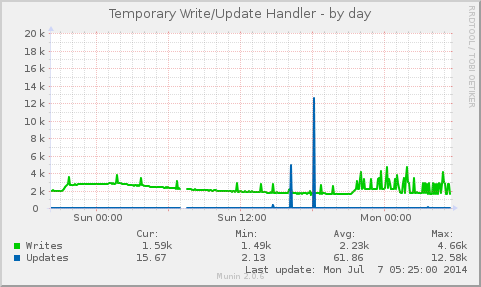
Aside if you’re interested in graphing:

If you want to do XY graphs using the time as a X column I suggest using logmerge’s –tempfile option then:

sed -i -e 's/^\(..............\)_\([^ ]*\)\(.*\)/\1\3/g' logfile

After this and the first column with be a YYYYMMDDHHMMSS time and thus usable on an X axis. I was having trouble using Libreoffice Calc for this on a 2 million line log file though putting the file with a .csv extension helped.

Posted on 1 Comment
Posted on 3 Comments

Optimising Web Servers

I was lucky enough to attend PyCon-AU recently and one talk in particular highlighted the process of web server optimisation.

Graham Dumpleton’s add-in talk Web Server Bottlenecks And Performance Tuning available on YouTube (with the majority of PyCon-AU talks)

The first big note at the beginning is that the majority of the delay in user’s perception of a website is caused by the browser rendering the page. Though not covered in the talk for those that haven’t used the tool YSlow (for Firefox and Chrome) or Google’s Developer Tools (ctrl-alt-I in Chrome), both tools will give you pretty much identical recommendations as to how to configure the application page generated and server caching /compression settings to maximise the ease at which a web browser will render the page. These recommendations also will also minimise the second most dominate effect in web pages displayed, network latency and bandwidth. Once you have completed this the process of making web pages faster on the web server begins to take a measurable effect to the end user.

The majority of the talk however continues talking about web server configuration. The issues you will find at the web server are the memory, CPU and I/O are the constraints that you may hit depending on your application.

Measuring memory usage by considering an applications use of memory multiplies by how many concurrently running processes will give you an idea of how much memory is needed. Remember always that spare memory is disk cache for Linux based systems and this is significant in reducing I/O read time for things like static content serving. Memory reduction can be helped by front-end proxying as described by the question at offset 19:40 and relating it to the earlier description of threads and processes.  In short the buffering provided by Nginx in a single process on the input ensures that the application code isn’t running until a large amount of input is ready and that output is buffered in Nginx such that the process can end quicker while Nginx trickles the web page out to the client depending on the network speed. This reduction in the running time of the application enables the server to support better concurrency and hence better memory usage. This is why we at Open Query like to Nginx as the web server for the larger websites of our clients.

Database is effectively an I/O constraint from the web server perspective as it should be on a different server if you run something more than a simple blog or an application where database utilisation is very low.  A database query that requires input from the web request that takes a long time to run will add to the time taken in rendering the page in fairly significant terms. Taking note of which queries are slow, like enabling the slow query log is the first step to identifying problem. Significant gains can usually be made by using indexes and using the database rather than the application to do joins, iterations and sorting. Of course much more optimisation of server and queries is possible and Open Query is happy to help.

Thanks again to PyCon speakers, organisers, sponsors and delegates. I had a great time.

Posted on 3 Comments